In EQuIS Professional, the data grid offers several options for viewing and exporting data in EQuIS tables, views, or grid reports.
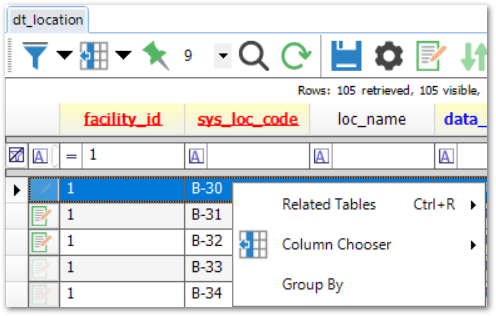
Context Menu
The following options are available after right-clicking within a grid:
•Related Tables – show parent or child table entries for each record (only available in tables)
•Column Chooser – configure how columns display
•Group By – turns on Group By mode, described below
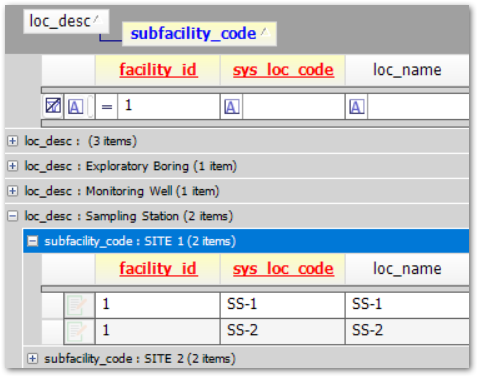
Group By
Right-click on the grid and select Group By to enable Group By mode. The Group By bar will appear in grey above the columns with instructions:
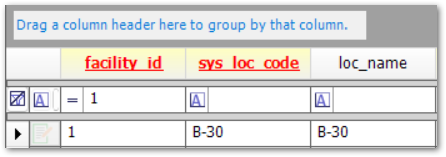
Drag a column to the Group By bar to group by that column. Drag a column out of the Group By bar to remove that grouping. Dragging multiple columns will group by each, in order:
Grid Toolbar
|
Filter columns. Once enabled, select the Filter button or dropdown in a column to select specific values. |
|---|---|
|
Pin specific columns for easy data review when scrolling back and forth. |
|
Column Chooser to hide, unhide, or reorder columns. |
|
Font size chooser to temporarily change the grid display by selecting a font size using the dropdown menu. |
|
Search for information in rows and columns of tables using the Find and Replace Dialog. Click the icon in the toolbar, or use shortcuts Ctrl+F or Ctrl+H. |
|
Refresh tables to display recent changes. |
|
Save changes made to a table. |
Note: Save is not an option in Views in EQuIS Professional. A View contains methods to review data, not to modify data. |
|
Options to change the appearance of column headers and rows. |
|
Toggle Notes Column, not available in Views. |
|
Toggle Add New Box, not available in Views. |
|
Cascade Delete, not available in Views. Deletes selected row(s) and all child rows in the database. |
|
Find All Child Records in the database, not available in Views. |
|
Export to Excel for rows of the grid that are currently visible. |
|
Exports (see following section) |
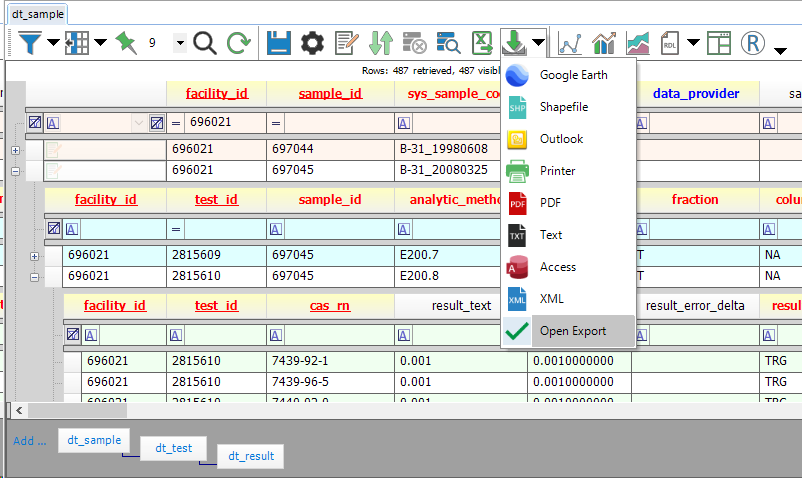
Exports
The Exports ![]() button in the grid toolbar opens the Exports dropdown menu.
button in the grid toolbar opens the Exports dropdown menu.
|
Display in Google Earth (requires X_COORD and Y_COORD as row headers). |
|
Export Shapefile. |
|
Export to Outlook as an *.xls attachment in a message. |
|
Send to Printer |
|
Export PDF |
|
Export TXT, including the following Save as type options: •Tab Separated (*.txt) •Comma separated (*.csv) •HTML (*.htm) •JSON Schema/Data (*.json) - This is the concise JSON format typically used in Enterprise widgets that lists the columns once, then lists each row as an array of values. •JSON Table (*.json) - This is a more verbose JSON format that lists each row as an object with properties. •Compressed Data Table (*.cdt) - This is a compressed, binary format (not human-readable). |
|
Export to Access as an *.mdb file. |
|
Export to XML. If exporting to XML for the purpose of importing through EDP to an EQuIS database, review this Known Issue forum post. |
|
Open Export toggle; deselecting this option prevents exports from opening automatically once created. |
Other Report Output
|
Create an XY Chart. |
|---|---|
|
Create an XYZ Chart. |
|
Create a Trend Chart. |
|
Create a RDL Report. |
|
Create a Crosstab Report. |
|
Launch and export to RStudio. |